2.1. 4: Ecological pyramids
Pyramids of number
A bar diagram that indicates the relative numbers of organisms at each trophic level in a food chain. The length of each bar gives a measure of the relative numbers. Pyramids begin with producers, usually the greatest number at the bottom decreasing upwards.

Advantages
This is a simple easy method of giving an overview and is good at comparing changes in population numbers with time or season.
 Disadvantages
All organisms are included regardless of their size, therefore a system say based on an oak tree would be inverted (have a small bottom and bet larger as it goes up trophic levels). Also they do not allow for juvenilles or immature forms. Numbers can be to great to represent accurately.

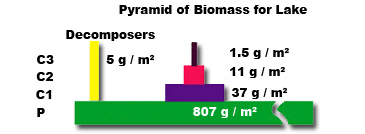
Pyramids of biomass
As pyramids of number but uses dry mass of all organisms at each trophic level.
Advantages
Overcomes the problems of pyramids of number.
Disadvantages
Only uses samples from populations, so it is impossible to measure biomass exactly.also the time of the year that biomass is measured affects the result.
Pyramids of energy
The bars are drawn in proportion to the total energy utilized at each trophic level. Also the productivity of producers in a given area measured for a standard time, and the proportion utilized by consumers can be calculated.
Advantages
Most accurate system shows the actual energy transferred and allows for rate of production.
Disadvantages
It is very difficult and complex to to collect energy data.
Why use ecological pyramids.
Ecological pyramids allow you to examine easily energy transfers and losses. They give an idea of what feed s on what and what organisms exist at the different trophic levels. They also help to demonstrate that ecosystems are unified systems,that they
are in balance.